Every organization, with its economic question
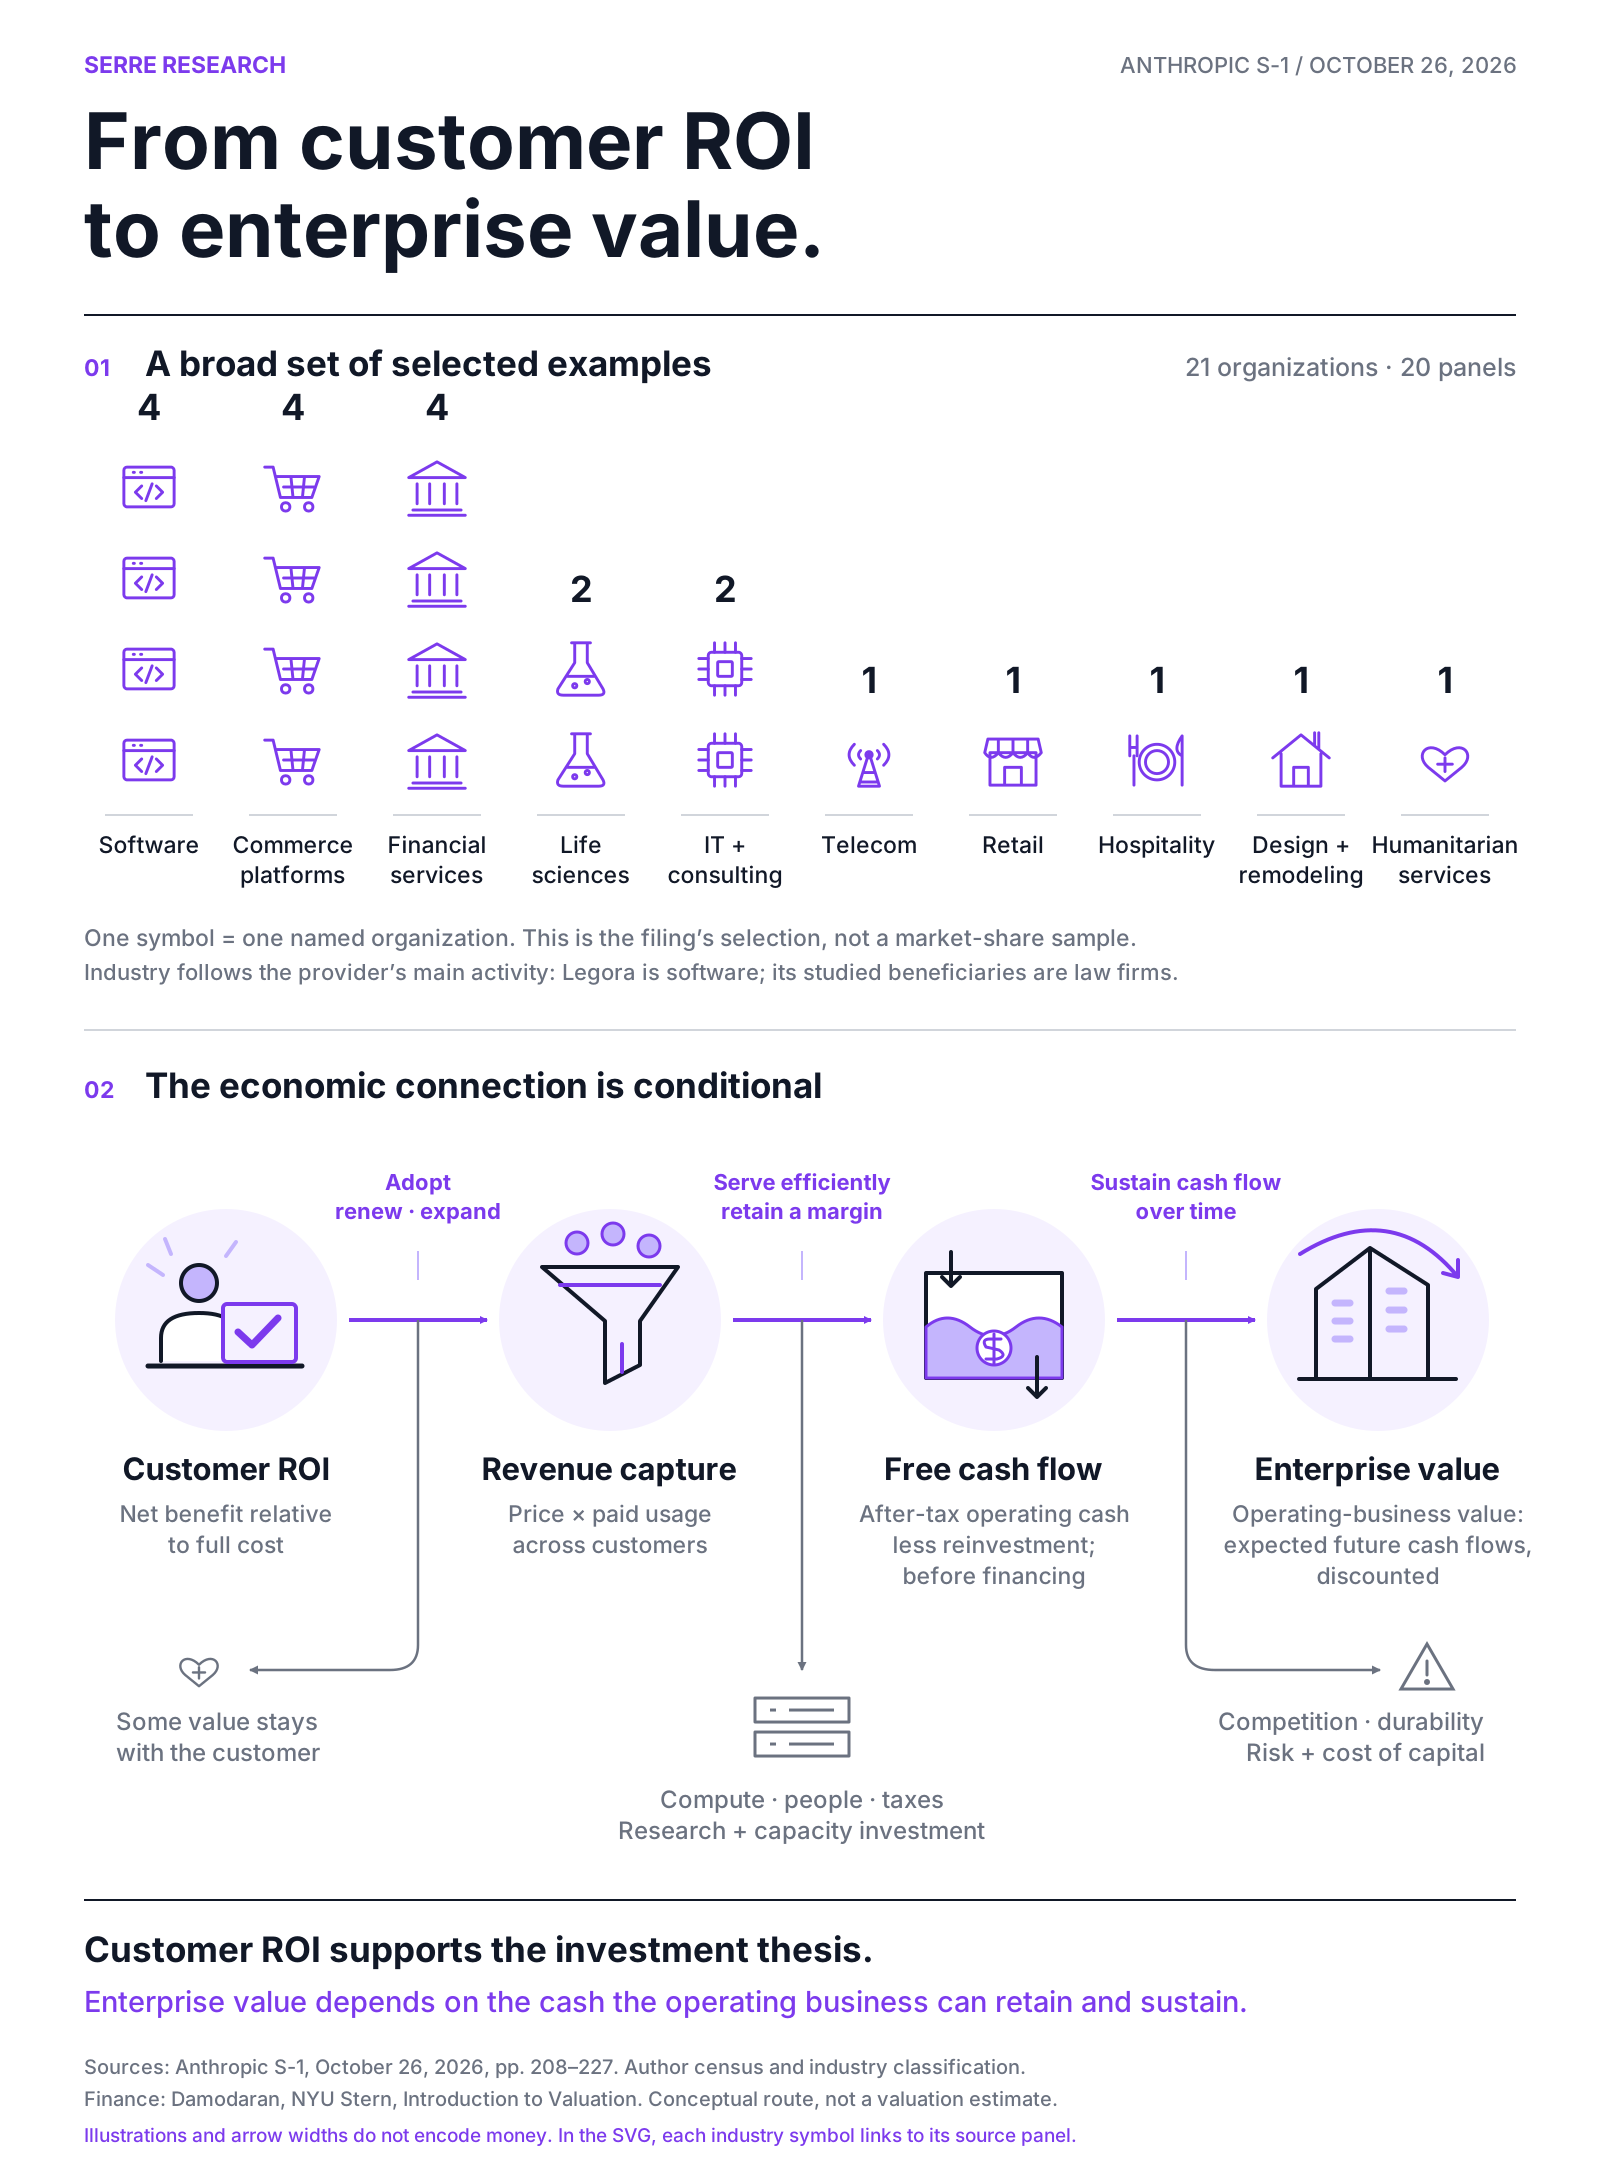
21 organizations. 20 panels. Ten industries.
Browse the evidence
Industry follows the named organization’s primary activity; the beneficiary industry is shown separately. These are selected examples, not a survey of customer outcomes. Shy Bird and KBF share panel 20 but belong to different industries.
Showing 21 organizations across 20 panels
Software 4 organizations
LegoraSoftware · Legal AI software · Panel 07, printed page 214
Classifies the platform provider as software. The 31-firm study concerns law firms; Legora's own engineering deployment is a separate scope.
- Beneficiary industry
- Legal services
- Reported for this organization
- 1,500+ law firms and in-house teams served
- Independent study of 31 firms across 14 countries: lawyers reported recapturing an average 4.3 non-billable hours weekly, associated in the text with $6.9M additional annual billing per 100 lawyers
- A first-pass review of a 900-document M&A data room across four jurisdictions took half a day versus a week for a conventional team
- Legora engineering team about 80; Claude Code seats grew about 50 to more than 700 company-wide
- Panel population and period
- 31 firms/14 countries disclosed. Public report clarifies qualitative representative interviews and 46-week annualization. Underlying lawyer count, measured effort, realized billing/collection, and attribution to Claude versus the whole platform are not established.
- Potential economic mechanism
- Recaptured non-billable capacity may convert into paid legal work or other service improvements
- What can be calculated
- Using the public report's 46-week formula, 100 × 4.3 × 46 = 19,780 hours. At an inferred $350/hour, potential gross billing is $6,923,000. This is a modeled opportunity, not observed collected revenue. Prior 48–52-week implied-rate estimates miss the published method.
- What a dollar model still needs
- Achieved billing rate, share of recaptured capacity sold, additional demand, collection, pricing model, incremental delivery/platform costs, and attribution. Public report supplies 46 working weeks; $350/hour is inferred, not observed.
- Interpretation boundary
- Do not say none of the cases cites independent evidence. Do not infer the filing's billing figure was collected cash. Attribution runs through a partner platform and its workflow.
- Additional primary-source context
- The Ari Kaplan/Legora report describes qualitative interviews with representatives of 31 customer firms across 14 countries. Page 6 labels $6.9M potential annual billing and provides lawyers × weekly recovered nonbillable hours × average hourly billing rate × 46 weeks. $350/hour is inferred as consistent with the $6.923M calculator, not an observed rate. This is not verified time tracking for every lawyer. Live landing page https://legora.com/roi-law-firms displays 3.3 hours/$5.4M while linked PDF retains 4.3/$6.9M and calculator $6.923M; unresolved source-version conflict.

MozillaSoftware · Browser software and internet technology · Panel 10, printed page 217
Classifies Mozilla by its browser-software activity, not legal form. Firefox users and the wider software ecosystem benefit from security fixes.
- Beneficiary industry
- Cross-industry internet users
- Reported for this organization
- 22 previously unknown vulnerabilities identified by Opus 4.6 during a two-week evaluation, including 14 high severity; resolved in Firefox 148
- An additional 271 vulnerabilities identified by Mythos Preview; fixes shipped two months later in Firefox 150
- Panel population and period
- Distinct evaluated batches and release versions. Exposure population, likelihood of exploitation, baseline detection timing, incident losses, and full evaluation/remediation cost not given.
- Potential economic mechanism
- Earlier removal of security exposures; discovery coverage and risk reduction
- What can be calculated
- 22 + 271 = 293 resolved vulnerabilities across the two disclosed batches, because the body calls the latter additional. This is a count, not annual benefit.
- What a dollar model still needs
- Counterfactual exposure window, exploit likelihood, loss conditional on exploit, remediation costs, detection costs, and overlapping vulnerabilities/incidents
- Interpretation boundary
- Bug bounty equivalents are procurement prices, not avoided incident losses. Do not add bounty values and expected losses for the same security outcome; do not assume each vulnerability produces an independent breach.

SalesforceSoftware · CRM and enterprise collaboration software · Panel 13, printed page 220
The cited outcomes concern Salesforce's internal engineering and Slackbot use; do not substitute the industry of external CRM customers.
- Beneficiary industry
- Software
- Reported for this organization
- Pull requests merged per developer +79% over last year; effective output per developer +151%; incidents -5%
- One team migrated 33 API endpoints in 13 days against an estimate of 231 person-days
- Slackbot estimated 8.1M hours of annualized productivity gains, more than twice prior quarter
- 99% of employees use Slackbot; more than 60% of 83,000 employees directly use Claude
- Panel population and period
- Filing says last year; May27 Salesforce article specifies April2026 versus April2025 and explains a separate ML-based Effective Output metric. Detailed score method and matched task/headcount sample absent. Annualized hours are Slackbot, not direct-Claude cohort. Migration actual person-effort not given.
- Potential economic mechanism
- Engineering throughput and broad knowledge-work capacity; partner platform capability
- What can be calculated
- 8.1M / (83,000 × 52) = about 1.88 hours per employee per week using 52 weeks and all employees, an implied scale check, not a measured user average. A 99%-of-employees denominator would be about 1.90.
- What a dollar model still needs
- Hours-estimation method, incremental effect, matched population, effort/rework, loaded rates, capture action, ongoing cost, and net outcome
- Interpretation boundary
- Do not divide hours by only direct Claude users. Person-days and elapsed days are incompatible units; 231-13 is not proven person-days saved. Incident counts and merged PR counts do not define a valid defect rate without aligned populations. Salesforce owns less than 1% of Anthropic on an as-converted basis.
- Additional primary-source context
- Salesforce specifies April2026 versus April2025: PRs merged/developer +79%; Effective Output +151.3% is a separate machine-learning-based score, not an arithmetic conversion of PR growth. Its method is not fully published. Total incidents -5%. The source retains estimated231person-days versus13elapseddays ambiguity.

SAPSoftware · Enterprise application software · Panel 14, printed page 221
SAP is the software provider. The Joule for Consultants outcomes concern the consulting ecosystem, with client benefits depending on contract terms.
- Beneficiary industry
- IT and consulting services
- Reported for this organization
- Joule for Consultants: up to 14% faster project delivery and 25 hours saved per consultant per month
- Body describes savings up to 1.5 hours daily
- Knowledge base includes more than 25M documents and 12 TB of expertise data
- Panel population and period
- Consultant sample, deployed user count, measurement dates, baseline, methodology, and model mix not supplied. Global ecosystem extends beyond SAP's own workforce.
- Potential economic mechanism
- Faster access to trusted implementation knowledge; capacity, fixed-price delivery economics, or client time/cost benefit
- What can be calculated
- 25 × 12 = 300 hours per year per consultant only at an explicit 12-month persistence assumption; do not combine daily and monthly figures as separate benefits.
- What a dollar model still needs
- Actual affected consultant count, time saving distribution, contract model, billing and collection, rates, who captures benefit, and total cost
- Interpretation boundary
- Consultant time saved may reduce billings under time-and-materials, enable more engagements, or improve fixed-fee margin. SAP financial labor cost is not automatically representative of its partners' consultants. SAP owns less than 1% of Anthropic as converted.

Commerce platforms 4 organizations
DoorDashCommerce platforms · Local commerce and delivery platform · Panel 04, printed page 211
Primary activity classification covers DoorDash. The panel measures internal product delivery and engineering, not a restaurant-industry deployment.
- Beneficiary industry
- Commerce platforms
- Reported for this organization
- Claude Code and Cowork available to every corporate employee
- 7,000+ monthly Cowork users; almost half use it daily
- Major product launch timelines reduced by more than half
- One engineer finished a migration in three weeks versus a historical estimate of four engineers for more than a quarter
- Panel population and period
- Claude Code rollout in 2025; company-wide Cowork rollout in 2026. Number of launches, baseline dates, workload comparability, and migration-effort allocation absent.
- Potential economic mechanism
- Earlier availability of useful products and less migration effort
- What can be calculated
- A 13-week quarter would imply more than 52 engineer-weeks historically versus three engineer-weeks now, only under full-time staffing assumptions. Treat as one project, not recurring annual savings.
- What a dollar model still needs
- Affected release count, baseline dates, launch-dependent demand, net contribution, whether timing advances total demand or only shifts it, resource effort, and tool costs
- Interpretation boundary
- Company revenue growth is not the revenue base for the affected launches. Earlier launch value may be a timing/NPV benefit, incremental demand, or competitive option value; these cannot be assumed simultaneously.

Mercado LibreCommerce platforms · Marketplace and fintech platform · Panel 09, printed page 216
Uses the primary commerce-platform bucket despite the group's fintech activities. Engineering and finance-close outcomes are internal.
- Beneficiary industry
- Commerce platforms
- Reported for this organization
- Q2 2026 year over year: code submissions +110%, merged code more than +100%, deployments nearly +75%; rollbacks down year over year
- 500,000+ submissions reviewed with human oversight and roughly 9,000 services migrated over past year
- 23,000+ developers use Claude Code
- Monthly financial close shortened by one-third
- 78% weekly activity across non-tech teams; quotation says Cowork reaches 31,000 employees, while body describes more than 26,500 across named non-engineering teams
- Panel population and period
- Engineering year-over-year comparison specified for Q2 2026; hours, developer normalization, rollback denominator, close baseline, and matched populations absent.
- Potential economic mechanism
- More accepted deployments, infrastructure upkeep, earlier management information
- What can be calculated
- A one-third shorter close means elapsed duration becomes about two-thirds of its baseline; it does not imply a third of finance payroll is saved.
- What a dollar model still needs
- Useful output per labor hour, affected costs, quality-adjusted effort, close-task effort, causal contribution, marginal business outcome, capture, and cost
- Interpretation boundary
- Code growth is not a matched per-person productivity metric. Do not silently reconcile 31,000 vs 26,500 scopes, or reuse a prior-year public headcount as the filing's deployment denominator.

RakutenCommerce platforms · Digital commerce and services platform · Panel 12, printed page 219
Uses a primary-activity bucket for the diversified group. The panel spans business units; do not infer every beneficiary is in commerce.
- Beneficiary industry
- Multiple industries
- Reported for this organization
- 70+ business units using AI
- 24 to five working days for new-feature time to market
- Seven or more hours of autonomous coding with limited human guidance and 99.9% accuracy on complex modifications
- Major releases every two weeks instead of quarterly
- Every agent job measured on task completion and cost per task; work routed by capability and cost
- Panel population and period
- Feature count, time window, accuracy definition and sample, rework, adoption by workload, and cost-per-task values absent.
- Potential economic mechanism
- Faster useful releases and lower cost for completed work, with appropriate model selection
- What can be calculated
- 24 to five working days = 19 fewer days, or a 79.2% reduction in elapsed time for the reported comparison.
- What a dollar model still needs
- Accepted-task volume, end-to-end cost including review/retry, useful feature contribution, critical path, and incremental demand
- Interpretation boundary
- Do not use group margin to price a specific feature without matching economics. Anthropic's generic approximately 40% Opus cost-per-task reduction on page 195 is not Rakuten's measured saving.

ShopifyCommerce platforms · Commerce software platform · Panel 15, printed page 222
Classifies Shopify as a commerce platform. Sidekick's merchant outcomes and Shopify's internal engineering outcomes have different beneficiaries.
- Beneficiary industry
- Retail and other merchant businesses
- Reported for this organization
- Daily active merchants using Sidekick more than tripled year over year in 2026
- Nearly half of Shopify Flow automations created in the quarter were built with Sidekick
- New merchants reach their first sale in days instead of weeks
- Claude Code available company-wide across more than 7,500 employees
- Panel population and period
- Active-merchant counts, exact quarter, first-sale cohort, first-sale distribution, and comparison design absent. Claude is one of the models powering Sidekick.
- Potential economic mechanism
- Faster merchant activation, lower work burden, more business capability
- What can be calculated
- None suitable for revenue or value extrapolation.
- What a dollar model still needs
- Activation base, incremental retained merchants, causal effect, GMV and contribution, merchant costs, model attribution, and platform cost
- Interpretation boundary
- Threefold usage is not threefold merchant revenue. Distinguish merchant outcomes from Shopify's own internal deployment and capture.

Financial services 4 organizations
AIGFinancial services · Property and casualty insurance · Panel 02, printed page 209
The commercial funnel concerns Lexington Middle Market Property; broader review-time statements are not automatically the same cohort.
- Beneficiary industry
- Financial services
- Reported for this organization
- Eight business lines use Claude as of March 31, 2026
- Lexington Middle Market Property: quoted submissions +30%, time to quote -55%, submissions bound +40%
- Where deployed, submission review time fell more than 90%, enabling review of 100% of applicable submissions
- Early claims pilots reduced response time from days to hours and coverage reviews from hours to minutes
- Panel population and period
- Headline metrics as of March 31, 2026; baseline period, submission counts, premium mix, losses, and comparison design not supplied.
- Potential economic mechanism
- Review more suitable risks, quote faster, write additional profitable business
- What can be calculated
- If the +30% quoted and +40% bound counts cover identical populations and periods, binds per quote rise by about 7.7% relatively (1.4/1.3-1); not demonstrated by the page.
- What a dollar model still needs
- Affected submission/bind base, premium per policy, causal increment, expected loss and expense ratios for new business, capacity capture, and system cost
- Interpretation boundary
- Bound counts are not premium or profit. Freed review time is a mechanism for throughput, not automatically a second additive benefit. Proposed multi-agent workflows are future exploration.

Jane StreetFinancial services · Trading and market making · Panel 06, printed page 213
Internal coding evaluations and researcher examples concern a trading firm, not a reported investment return.
- Beneficiary industry
- Financial services
- Reported for this organization
- Fable 5.1 improved by 32% on Fable 5 in Jane Street's internal agentic coding evaluation
- One large codebase migration took about one week versus months for similar work by a team
- One researcher estimates about 50% more analysis than a year earlier
- Panel population and period
- Evaluation task count, scores, baseline scale, and dates absent; migration and researcher reports are individual examples.
- Potential economic mechanism
- Higher research throughput, more experiments, less migration effort
- What can be calculated
- None suitable for enterprise-wide dollar extrapolation.
- What a dollar model still needs
- Validated output, affected workload, staffing effort, incremental trading/research contribution, risk, and costs
- Interpretation boundary
- 32% evaluation improvement is not 32 percentage points, 32% productivity, or 32% trading return.

PayPalFinancial services · Digital payments · Panel 11, printed page 218
The measured time saving concerns PayPal sales-plugin users. Merchant service benefits remain a separate downstream scope.
- Beneficiary industry
- Financial services
- Reported for this organization
- 12,000+ Claude Enterprise monthly active users across product, technology, and sales
- Custom sales plugin used since August 2025 reportedly saves an average 45 minutes per sales team user per week
- AMOS report preparation now 5–10 minutes; portfolio insights available in minutes instead of days
- Panel population and period
- 45-minute population is sales-plugin users, not all 12,000. Sales sample size, method, duration, and quality not supplied.
- Potential economic mechanism
- Less report and account-review work; more time with merchants
- What can be calculated
- 45 minutes = 0.75 hour weekly per affected user; 36 hours at 48 weeks or 39 at 52 weeks, each an annualization assumption.
- What a dollar model still needs
- Sales-plugin user count, persistence, loaded rate, redeployment, incremental merchant outcome, avoidable expense, and cost
- Interpretation boundary
- Do not apply sales-team savings to every employee or conclude this is the least valuable deployment from the narrow disclosed metric.

TravelersFinancial services · Property and casualty insurance · Panel 16, printed page 223
The disclosed metric concerns internal software-flow improvement at an insurer.
- Beneficiary industry
- Financial services
- Reported for this organization
- Nearly 25,000 employees have Claude assistants, up from nearly 10,000 engineers, data scientists, analysts, and product owners in January 2026
- Time to merge code reduced by 50%
- Panel population and period
- No merge count, baseline duration, measurement interval, engineering-only population, effort, or quality denominator.
- Potential economic mechanism
- Reduced waiting and faster delivery; possible attention and coordination benefit
- What can be calculated
- Merge duration becomes half its prior value; no staffing-hour translation follows.
- What a dollar model still needs
- Merge count, queue wait versus active effort, concurrent work, critical-path effect, effort savings, useful output, and costs
- Interpretation boundary
- Do not convert PR-days removed into labor hours using invented context-switch assumptions and present the result as observed capacity.

Life sciences 2 organizations
Bristol Myers SquibbLife sciences · Biopharmaceuticals · Panel 03, printed page 210
The measured workflow is real-world-evidence inquiry inside BMS; patient and clinical effects are not measured in the panel.
- Beneficiary industry
- Life sciences
- Reported for this organization
- 30,000+ employees have Claude access; more than 3,000 global developers and data scientists initially used Claude Code
- Time to generate an answer to a real-world-data question fell from up to two months to five minutes or less
- Claude works across 30–40 external medical-record and claims databases; dozens of internal sources connected
- Panel population and period
- Company-wide platform selected in May 2026; no question count, distribution, comparison cohort, validation quality, or measured staffing effort.
- Potential economic mechanism
- Faster access to institutional evidence and earlier decisions; possible removal of critical-path delays
- What can be calculated
- No exact average time saving: old period is an upper bound and new period a ceiling; months are elapsed time, not analyst-hours.
- What a dollar model still needs
- Question frequency, active analyst effort, quality review, share on a decision's critical path, downstream decision value, contribution timing, and deployment cost
- Interpretation boundary
- Do not treat every faster answer as earlier drug approval or market entry. Access to all employees does not mean all use every product; company-wide Cowork rollout remains planned in body.

LillyLife sciences · Biopharmaceuticals · Panel 08, printed page 215
Refers to Eli Lilly and Company. Access and engagement cover specified internal functions, not a measured clinical result.
- Beneficiary industry
- Life sciences
- Reported for this organization
- 50,000+ employees have Claude Enterprise access
- Fivefold expansion since roughly 10,000-person July 2025 rollout; company-wide access by April 2026
- More than 85% of full-time employees in five heavily using functions actively engage
- Panel population and period
- Five functions are legal/compliance, technology, finance, oncology, and research. Activity window and denominator counts not specified. Claude Science pilot began October 2026.
- Potential economic mechanism
- Broader access to scientific and operational tools; custom tools and visualization
- What can be calculated
- Access increased about fivefold; do not infer a fivefold value gain.
- What a dollar model still needs
- Measured task-level change, affected volume, quality, effort, downstream outcomes, cost, and capture action
- Interpretation boundary
- 85% is not company-wide adoption. Adoption is a meaningful revealed-preference signal, but does not measure benefit or net return.

IT and consulting services 2 organizations
AccentureIT and consulting services · Technology consulting and services · Panel 01, printed page 208
Accenture is the provider. The reported first-year return belongs to an unnamed broadband customer in the filing, matched to Cox in a public story; internal security is a separate Accenture scope.
- Beneficiary industry
- Telecommunications; IT and consulting services
- Reported for this organization
- 45,000 professionals trained; more than 18,000 certified practitioners
- Internal security scan coverage increased from about 10% to over 80%; turnaround fell from days to under an hour, across 1,600 applications and 500,000+ APIs
- Broadband customer reported 7x return on AI investment in its first year, 55% faster speed to market, 86% lower cost of validating a sales lead, and accuracy rising from 13% to 97%
- Panel population and period
- Accenture internal deployment plus a separate unnamed joint customer. Broadband comparison covers first year; dates, sample counts, control, and ratio definition absent.
- Potential economic mechanism
- Security coverage and faster validation; broadband lead economics and commercial speed
- What can be calculated
- Coverage moved by more than 70 percentage points. Do not turn a 7x multiple into 700% net ROI without its definition.
- What a dollar model still needs
- Broadband investment denominator, gross versus net return definition, costs included, benefit attribution, revenue and margin bases, and cash timing
- Interpretation boundary
- Do not attribute the broadband return to Accenture itself or assume the unnamed customer is Verizon. A matching public Anthropic story names Cox, but the S-1 does not. First-year period is disclosed. Lead-validation savings and commercial throughput can overlap.
- Additional primary-source context
- Anthropic publicly names Cox Communications in a matching case with the same sevenfold first-year return, 55% speed-to-market change, and 86% lead-validation-cost reduction. The story says capacity was redirected into growth. It still does not expose a reconstructible ROI numerator and denominator. The same public page inconsistently gives lead-accuracy baseline as 13% in the challenge and 18% in the results; filing says 13%. Preserve the discrepancy.

USTIT and consulting services · Technology and engineering services · Panel 17, printed page 224
UST is the service provider. The hardware-validation workflow serves semiconductor/electronics clients; provider and client capture differ.
- Beneficiary industry
- Semiconductors and electronics
- Reported for this organization
- 20,000 associates training on Claude worldwide
- Chip validation cycle time reduced 50–70%
- Standard validation turnaround four to two days
- Panel population and period
- Measured on UST hardware-validation platform; number of cycles, staffing, active effort, task mix, baseline window, and client economics not supplied.
- Potential economic mechanism
- Faster test cycles and detection before production; potentially earlier development milestones
- What can be calculated
- Four to two days is a 50% elapsed-time reduction for the standard comparison, consistent with the lower end of the broader reported range.
- What a dollar model still needs
- Cycle volume, active effort, staffing, critical path, client capture, contract economics, risk and cost
- Interpretation boundary
- Faster turnaround does not prove two days of every engineer's time is freed or an earlier tape-out. Training is ongoing, not a count of completed training.

Telecommunications 1 organization
VerizonTelecommunications · Integrated telecommunications · Panel 18, printed page 225
Classifies the named organization. It is not identified as the unnamed broadband customer in Accenture's filing panel.
- Beneficiary industry
- Telecommunications
- Reported for this organization
- 33,000+ engineers build with Claude Code
- Joined Project Glasswing and partnered with Anthropic in May 2026 to test Mythos for network cybersecurity
- Panel population and period
- No task-level outcome, baseline, quantified time, quality, or financial result disclosed.
- Potential economic mechanism
- Developer capability and prospective network defense
- What can be calculated
- None.
- What a dollar model still needs
- Affected workflows, measured outcomes, quality, resource effort, costs, and capture
- Interpretation boundary
- Do not equate the number of engineers with hours saved or treat access as universal use intensity. Do not identify Verizon as the unnamed broadband customer.

Retail 1 organization
WalmartRetail · General merchandise and grocery retail · Panel 19, printed page 226
The Sparky comparison concerns shoppers and retail orders, rather than an enterprise-software customer cohort.
- Beneficiary industry
- Retail
- Reported for this organization
- Sparky weekly active users grew 110% quarter over quarter
- Average order value for Sparky orders 35% higher than non-Sparky orders
- Units sold via Sparky doubled quarter over quarter
- Panel population and period
- Quarter, order counts, cohort composition, treatment assignment, controls, share of orders, and merchandise/margin mix absent.
- Potential economic mechanism
- Better shopping decisions and possibly larger baskets or incremental conversion
- What can be calculated
- Sparky AOV is reported as 1.35 times comparator AOV. The uplift is 0.35/1.35 = 25.93% of observed Sparky sales only under a matched-order counterfactual; causality is still unestablished.
- What a dollar model still needs
- Eligible order base, exposed order share, causal lift, channel shift, substitution, incremental contribution after fulfillment/returns, and cost
- Interpretation boundary
- AOV association is not causal sales lift. User and unit growth do not independently validate incremental demand, because rollout and selection can drive them. Claude is also one of multiple models in Walmart's internal developer agent.

Hospitality 1 organization
Shy BirdHospitality · Restaurants · Panel 20, printed page 227
Shares filing panel 20 with KBF. Restaurant operations are classified separately from the owners' Colette software venture.
- Beneficiary industry
- Hospitality
- Reported for this organization
- Shy Bird: brunch ticket times reduced more than 60% to 12 minutes at a location; Claude-informed kitchen redesign implemented with cooks
- Shy Bird owners' Colette platform now used by 60 restaurants; a server became a full-time backend engineer in six months
- Panel population and period
- Shy Bird local brunch process; baseline period and ticket count absent. KBF annual project count and one-employee hours stated; sales base, mix, margin, time period, and counterfactual absent.
- Potential economic mechanism
- Shy Bird: operational bottleneck removal and potential service/throughput gain. KBF: designer attention shifted from administration to design, with reported sales growth.
- What can be calculated
- KBF seven hours × 70 projects = 490 hours. At an explicitly assumed 2,080-hour work year this is 23.6% of one FTE's hours; not a removed job. Shy Bird >60% shorter to 12 minutes implies prior >30 minutes under the same metric.
- What a dollar model still needs
- Shy Bird: orders, peak demand, table/kitchen constraints, margins, and redesign costs. KBF: saved-work validation, demand, project margin, causal share of growth, pricing and costs.
- Interpretation boundary
- Count as one page but two businesses. The kitchen change includes human implementation; AI advice alone is not the whole intervention. KBF redeployment is described, but payroll reduction is not. Do not ignore KBF's reported growth while calling it only a small labor-saving case.

Design and remodeling 1 organization
KBF Design GalleryDesign and remodeling · Interior design and remodeling · Panel 20, printed page 227
Shares filing panel 20 with Shy Bird. Its hours and sales-growth claims describe the design/remodeling operation.
- Beneficiary industry
- Design and remodeling
- Reported for this organization
- KBF: 490 annual hours recovered for one employee; seven hours removed per contract-scope-writing project; 70 projects designed annually by three designers
- KBF reports 32% sales growth since adopting Claude in 2025
- Panel population and period
- Shy Bird local brunch process; baseline period and ticket count absent. KBF annual project count and one-employee hours stated; sales base, mix, margin, time period, and counterfactual absent.
- Potential economic mechanism
- Shy Bird: operational bottleneck removal and potential service/throughput gain. KBF: designer attention shifted from administration to design, with reported sales growth.
- What can be calculated
- KBF seven hours × 70 projects = 490 hours. At an explicitly assumed 2,080-hour work year this is 23.6% of one FTE's hours; not a removed job. Shy Bird >60% shorter to 12 minutes implies prior >30 minutes under the same metric.
- What a dollar model still needs
- Shy Bird: orders, peak demand, table/kitchen constraints, margins, and redesign costs. KBF: saved-work validation, demand, project margin, causal share of growth, pricing and costs.
- Interpretation boundary
- Count as one page but two businesses. The kitchen change includes human implementation; AI advice alone is not the whole intervention. KBF redeployment is described, but payroll reduction is not. Do not ignore KBF's reported growth while calling it only a small labor-saving case.
Humanitarian services 1 organization
International Rescue CommitteeHumanitarian services · Humanitarian relief and refugee services · Panel 05, printed page 212
Classifies the named humanitarian organization. People served are beneficiaries, not an additional organization count or AI-attributable output.
- Beneficiary industry
- Humanitarian services
- Reported for this organization
- 300-user pilot expanded to roughly 2,400 seats; eightfold user growth from December 2025 to May 2026
- 464 staff hours returned per week
- Half of pilot users reported saving four or more hours a month
- Share of key health indicators used in strategic planning rose from 20% to 100%
- 20.5M+ people served in 2025 across 40 countries
- Panel population and period
- The page does not identify which population generated the 464 weekly hours. The 20.5M people is whole-organization reach, not incremental AI impact. Some care-intervention benefits are anticipated.
- Potential economic mechanism
- Reallocate staff attention, improve information available to care teams, and make earlier interventions possible
- What can be calculated
- 464 × 52 = 24,128 hours at an explicit 52-week assumption; 464 × 48 = 22,272 at 48 weeks. Neither establishes annual realized savings.
- What a dollar model still needs
- Measured survey denominator, persistence, work types and rates, redeployment choices, incremental care outcomes, marginal service costs, and full program costs
- Interpretation boundary
- Do not divide 464 by 2,400 and call the result a measured per-user saving. Average organization spend per person served cannot convert freed staff time into extra people served. Cash savings are unknown, not proven zero.

Full case analysis
Review date: October 26, 2026. Source: Anthropic's initial public S-1, filed that day, case-study pages 208–227, with separately cited primary-source follow-up. This is a review of the evidence disclosed, not an audit of customer operations. The filing contains 20 case-study pages covering 21 named customer organizations: Shy Bird and KBF share the final page. Accenture also describes an unnamed customer; other partners describe outcomes among their customers.
Each entry separates the reported result from the economic mechanism and the information needed to quantify it. Calculations below are arithmetic checks or explicitly conditional translations. They are not estimates of company-wide savings or realized return. A missing dollar figure means the return cannot be reconstructed from this page; it does not mean the deployment has no value. Original page images are linked so that the claims remain inspectable even where search tools omit image text.
Industry buckets are author classifications of each named organization’s primary activity, not GICS or an official filing classification. Provider industry and beneficiary industry are separate: Legora is software serving legal services; SAP is software serving consulting workflows; Accenture’s broadband customer is in telecommunications. The 21 organization entries below still refer to 20 source panels; panel 20 is split between Hospitality and Design and remodeling.
| Industry | Named organizations |
|---|---|
| Software | 4 |
| Commerce platforms | 4 |
| Financial services | 4 |
| Life sciences | 2 |
| IT and consulting services | 2 |
| Telecommunications | 1 |
| Retail | 1 |
| Hospitality | 1 |
| Design and remodeling | 1 |
| Humanitarian services | 1 |
Software
Legora — panel 07, page 214
Subsector: Legal AI software. Beneficiary industry: Legal services.
Classifies the platform provider as software. The 31-firm study concerns law firms; Legora's own engineering deployment is a separate scope.
Legora's page describes an independent study of 31 firms across 14 countries. Lawyers reported recovering an average of 4.3 non-billable hours weekly, associated in the text with $6.9 million of additional annual billing per 100 lawyers. It also describes a first-pass review of a 900-document, four-jurisdiction M&A data room in half a day instead of a conventional team's week. Filing, page 214.
The underlying Ari Kaplan/Legora report, page 6, clarifies the calculation: 100 lawyers × 4.3 weekly hours × 46 weeks = 19,780 annual hours. At an inferred $350 hourly rate, this produces $6.923 million of potential gross billing. The report describes qualitative interviews with customer-firm representatives, not verified time tracking for every lawyer. It does not establish conversion into additional paid work, collections, or profit. Follow those steps and incremental costs before asserting financial return. The live landing page showed 3.3 hours and $5.4 million on October 26, while its linked PDF retained 4.3 and $6.9 million and its calculator displayed $6.923 million. The version conflict remains unresolved.
Mozilla — panel 10, page 217
Subsector: Browser software and internet technology. Beneficiary industry: Cross-industry internet users.
Classifies Mozilla by its browser-software activity, not legal form. Firefox users and the wider software ecosystem benefit from security fixes.
Mozilla reports that a two-week Opus 4.6 evaluation identified 22 previously unknown Firefox vulnerabilities, including 14 high-severity issues. Fixes shipped in Firefox 148. An additional 271 vulnerabilities identified by Mythos Preview were fixed in Firefox 150 two months later. That makes 293 resolved findings across the two disclosed batches. Filing, page 217.
This is unusually concrete evidence of work completed, with named releases providing a verification path. The economic consequence remains uncertain. A vulnerability's value is not its bug-bounty price, and each vulnerability does not correspond to an independent future breach. Estimate risk at the exposure or incident level: likelihood and severity without remediation, likely alternative discovery date, and the change produced by earlier fixes. Include triage, reproduction, patching, regression testing, and deployment effort. Finding bugs can create additional necessary work while still reducing risk. This is a bounded set of remediation events, not an annual savings run rate unless recurrence is separately established.
SAP — panel 14, page 221
Subsector: Enterprise application software. Beneficiary industry: IT and consulting services.
SAP is the software provider. The Joule for Consultants outcomes concern the consulting ecosystem, with client benefits depending on contract terms.
SAP reports 25 hours saved per consultant per month through Joule for Consultants and project delivery up to 14% faster. The body also describes savings up to 1.5 hours daily. The solution uses SAP's expertise base, with more than 25 million documents and 12 terabytes of data, and serves a global consulting ecosystem. Filing, page 221.
The same improvement can have different economics. On a fixed-price project, fewer delivery hours may improve the provider's margin. Under time-and-materials, the customer may pay less. A capacity-constrained consultancy might instead take on more work. Count the outcome that actually occurs and identify who receives it. SAP's own employee costs cannot automatically price its partners' consultants. The filing omits active consultant count, sample, period, and measurement method. At 12 sustained months, 25 hours would annualize to 300 per consultant, but annual persistence is an assumption. Daily, monthly, and project-speed measures must not become three additive benefits. SAP also discloses an Anthropic holding below 1%.
Salesforce — panel 13, page 220
Subsector: CRM and enterprise collaboration software. Beneficiary industry: Software.
The cited outcomes concern Salesforce's internal engineering and Slackbot use; do not substitute the industry of external CRM customers.
Salesforce reports 79% more merged pull requests per developer and 151% more effective output per developer over the prior year, alongside 5% fewer incidents. Separately, Slackbot reportedly produces an estimated 8.1 million hours of annualized productivity gains, with 99% employee usage. More than 60% of Salesforce's 83,000 employees directly use Claude. Filing, page 220.
The hours belong to the Slackbot story, so dividing them only by direct Claude users mismatches the population. Spread across 83,000 employees and 52 assumed weeks, they imply about 1.88 hours weekly per employee. That is a scale check, not a measured average. The migration example contains another trap: 231 estimated person-days versus completion in 13 days. Without actual staffing, subtracting 13 from 231 does not yield saved person-days. Obtain the hours-estimation method, effective-output definition, measurement cohorts, and cash-capture action before pricing benefits. Salesforce's disclosed holding of less than 1% of Anthropic is relevant context, not evidence that the operational claims are false.
Primary-source follow-up: Salesforce's May 27 engineering account identifies April 2026 versus April 2025 and describes Effective Output as a machine-learning-based score, with 151.3% growth. It is separate from pull-request count, so the two percentages need not reconcile arithmetically. Its detailed scoring method remains unpublished in that account.
Commerce platforms
DoorDash — panel 04, page 211
Subsector: Local commerce and delivery platform. Beneficiary industry: Commerce platforms.
Primary activity classification covers DoorDash. The panel measures internal product delivery and engineering, not a restaurant-industry deployment.
DoorDash reports that major product launch timelines fell by more than half. It also describes one engineer completing a migration in three weeks that would previously have required four engineers for more than a quarter. More than 7,000 employees use Cowork monthly, with almost half using it daily. Filing, page 211.
Earlier delivery can be worth considerably more than the labor used to produce it, but the route matters. It might pull an unchanged stream of contribution forward, create genuinely incremental demand, or preserve a competitive opportunity. Those are different models. Annual company revenue growth is not a substitute for the revenue affected by these launches. Build a release-level comparison: expected launch without the intervention, actual launch, incremental contribution over time, and implementation costs. The migration provides a separate, bounded project example. Annualizing it requires evidence of comparable recurring projects, and translating staff counts into effort requires knowing whether those people worked full time.
Mercado Libre — panel 09, page 216
Subsector: Marketplace and fintech platform. Beneficiary industry: Commerce platforms.
Uses the primary commerce-platform bucket despite the group's fintech activities. Engineering and finance-close outcomes are internal.
For Q2 2026, Mercado Libre reports year-over-year growth of 110% in code submissions, more than 100% in merged code, and nearly 75% in deployments, while rollbacks declined. Its monthly financial close became one-third shorter. The page describes more than 23,000 developers using Claude Code and more than half a million submissions reviewed with human oversight over the preceding year. Filing, page 216.
The deployment and rollback signals make this richer than a code-volume story, but the figures still lack a shared effort denominator. They do not prove a doubling of output per engineer-hour. Measure accepted releases, operating quality, staffing effort, and maintenance burden across matched periods. For finance, separate a shorter reporting calendar from fewer work hours. Earlier insight can improve decisions without removing a third of finance costs. The page's quotation refers to 31,000 Cowork employees, while its body describes more than 26,500 across named non-engineering teams; preserve those scopes rather than forcing them into one denominator.
Rakuten — panel 12, page 219
Subsector: Digital commerce and services platform. Beneficiary industry: Multiple industries.
Uses a primary-activity bucket for the diversified group. The panel spans business units; do not infer every beneficiary is in commerce.
Rakuten reports a fall in feature time to market from 24 to five working days: 19 fewer days, or a 79.2% reduction in the reported elapsed-time measure. It also describes more than seven hours of autonomous coding with limited human guidance, 99.9% accuracy on complex modifications, and major releases every two weeks instead of quarterly. Filing, page 219.
The strongest measurement idea is in the prose: Rakuten assesses agent jobs by completion and cost per task, routing work to models according to capability and cost. That invites a better denominator than tokens or generated code. Extend it to accepted work, including retries, supervision, correction, and downstream defects. The page does not disclose task counts, its accuracy definition, or actual unit costs. Nor does a shorter feature cycle justify applying the group's overall margin to assumed revenue growth. Anthropic's separate 40% cost-per-task claim concerns its model release and must not be relabeled as Rakuten's measured savings.
Shopify — panel 15, page 222
Subsector: Commerce software platform. Beneficiary industry: Retail and other merchant businesses.
Classifies Shopify as a commerce platform. Sidekick's merchant outcomes and Shopify's internal engineering outcomes have different beneficiaries.
Shopify reports that daily active merchants using Sidekick more than tripled year over year in 2026, and that nearly half of Shopify Flow automations created in the quarter were built with Sidekick. It says new merchants reach their first sale in days instead of weeks. Separately, Claude Code is available across more than 7,500 employees. Filing, page 222.
The first-sale outcome is economically interesting because it is closer to merchant activation than tool adoption alone. Yet a faster first sale does not reveal additional lifetime sales or better retention. Establish the eligible cohort, first-sale distribution, comparable untreated experience, and subsequent merchant performance. Then distinguish merchant contribution from Shopify's share of the outcome. Claude is one of the models powering Sidekick, so the platform's effect is not automatically attributable entirely to Claude. Shopify's internal employee deployment is a separate value chain. Triple the number of active users is evidence of diffusion, not a tripling of merchant value or platform revenue.
Financial services
AIG — panel 02, page 209
Subsector: Property and casualty insurance. Beneficiary industry: Financial services.
The commercial funnel concerns Lexington Middle Market Property; broader review-time statements are not automatically the same cohort.
As of March 31, 2026, eight AIG business lines used Claude. The Lexington Middle Market Property example reports 30% more quoted submissions, 55% less time to quote, and 40% more submissions bound. Where deployed, submission-review time fell by more than 90%, enabling review of all applicable submissions. Filing, page 209.
This is a useful causal hypothesis: less review friction can expand the set of risks considered, leading to more quotes and potentially more profitable policies. But a policy count is not premium, and premium is not underwriting profit. The missing inputs include the affected baseline, premium and risk mix, expected losses, expenses, and the causal share of the increase. If quoting and binding cover identical periods and populations, their reported changes imply about 7.7% more binds per quote; the page does not establish that alignment. Freed underwriter time is part of this mechanism and should not automatically become a second benefit added to the resulting profit.
Jane Street — panel 06, page 213
Subsector: Trading and market making. Beneficiary industry: Financial services.
Internal coding evaluations and researcher examples concern a trading firm, not a reported investment return.
Jane Street reports a 32% improvement by Fable 5.1 over Fable 5 on its internal agentic coding evaluation. A researcher migrated a large codebase in about a week, compared with months normally required by a team for similar work. Another individual estimate describes about 50% more analysis than a year earlier. Filing, page 213.
The internal evaluation is valuable because it reflects tasks the customer cares about. It is still an evaluation result, not a 32% improvement in company productivity or trading returns. The filing does not give its sample size, starting score, or measurement period. For valuation, follow completed, accepted experiments through to actual decisions. Measure researcher effort, review burden, failed work, and execution cost alongside throughput. Some benefits may remain option value: testing more ideas can increase the chance of finding a useful one without making each extra experiment worth a predictable sum. A single researcher's estimate should remain an individual example.
PayPal — panel 11, page 218
Subsector: Digital payments. Beneficiary industry: Financial services.
The measured time saving concerns PayPal sales-plugin users. Merchant service benefits remain a separate downstream scope.
PayPal reports average savings of 45 minutes per week for sales-team users of a custom pipeline and account-risk plugin used since August 2025. It separately reports more than 12,000 monthly active Claude Enterprise users across product, technology, and sales. Its AMOS analytics platform produces reports in five to ten minutes and portfolio insights in minutes instead of days. Filing, page 218.
The sales measure is narrower than the company-wide user count. It cannot be multiplied by all 12,000 employees. At an explicitly assumed 48 weeks, 45 minutes becomes 36 hours annually per affected user; at 52 weeks, 39 hours. Establish the actual plugin population and whether the saving persists. Then examine what changes: more merchant conversations, faster risk review, reduced overtime, or a different outcome. Capacity can be valued at a relevant labor rate, but cash savings require an actual avoidable expense and capture action. The size of this one disclosed measure does not rank the entire deployment's value.
Travelers — panel 16, page 223
Subsector: Property and casualty insurance. Beneficiary industry: Financial services.
The disclosed metric concerns internal software-flow improvement at an insurer.
Travelers reports a 50% reduction in time to merge code. Access to Claude assistants expanded from nearly 10,000 engineers, data scientists, analysts, and product owners in January 2026 to nearly 25,000 employees. The page describes applications across software discovery, design, build, test, and deployment. Filing, page 223.
A shorter merge cycle may improve feedback, reduce coordination friction, and bring useful releases forward. It does not establish an equivalent reduction in coding effort. Engineers may work on other tasks while a pull request waits. Measure the baseline duration, number and type of changes, active work versus queue time, rework, and effect on actual releases. An assumed context-switch penalty per waiting day would be a new model input, not evidence supplied by the filing. Preserve the operational metric until the connection to labor capacity or business outcomes can be observed. The 25,000-person access count does not supply the missing engineering population.
Life sciences
Bristol Myers Squibb — panel 03, page 210
Subsector: Biopharmaceuticals. Beneficiary industry: Life sciences.
The measured workflow is real-world-evidence inquiry inside BMS; patient and clinical effects are not measured in the panel.
BMS reports that generating an answer to a real-world-data question fell from up to two months to five minutes or less. Claude works across 30–40 external medical-record and claims databases. The company selected Claude Enterprise as its company-wide platform in May 2026; the page reports access for more than 30,000 employees and an initial developer and data-scientist deployment exceeding 3,000 people. Filing, page 210.
The most interesting benefit may be a decision that becomes possible sooner. That is a hypothesis to investigate, not permission to value every question as an earlier medicine launch. Two months measures elapsed time, including possible queues and coordination; it is not two months of analyst labor. Track question volume, answer quality, active human effort, and which questions actually delay a downstream decision. For critical-path cases, value the specific decision and timing change. For the rest, retain capacity or information-access measures without forcing them into speculative drug-development dollars.
Lilly — panel 08, page 215
Subsector: Biopharmaceuticals. Beneficiary industry: Life sciences.
Refers to Eli Lilly and Company. Access and engagement cover specified internal functions, not a measured clinical result.
Lilly reports access to Claude Enterprise for more than 50,000 employees, following a roughly 10,000-person rollout in July 2025 and company-wide availability by April 2026. More than 85% of full-time employees in five heavily using functions actively engage with Claude. Those functions are legal and compliance, technology, finance, oncology, and research. Filing, page 215.
This is evidence of reach and engagement, with qualitative examples of scientists building tools and visualizing data. It is not an 85% company-wide adoption measure or a quantified scientific result. Broad adoption is still informative: the organization has invested in controls, integration, and practical access. The next step is to choose specific workflows and measure baseline effort, acceptable output, quality review, and downstream use. A tool that lets a scientist explore previously inaccessible data may create value beyond hours saved, but that claim needs a documented decision or research consequence. Access and the fivefold rollout expansion cannot supply the missing benefit denominator.
IT and consulting services
Accenture — panel 01, page 208
Subsector: Technology consulting and services. Beneficiary industry: Telecommunications; IT and consulting services.
Accenture is the provider. The reported first-year return belongs to an unnamed broadband customer in the filing, matched to Cox in a public story; internal security is a separate Accenture scope.
Accenture reports 45,000 professionals trained and more than 18,000 certified practitioners. Its own security deployment increased scan coverage from about 10% to over 80% and reduced turnaround from days to under an hour. Separately, an unnamed large US broadband customer reportedly achieved a sevenfold return on AI investment in its first year, 55% faster speed to market, an 86% reduction in lead-validation cost, and accuracy rising from 13% to 97%. Filing, page 208.
The value mechanisms are credible and distinct: security coverage for Accenture, commercial workflow economics for its client. They cannot be combined into one Accenture return. The sevenfold figure needs its investment base, included costs, and return definition; the first-year period is already stated. A benefit-cost ratio of seven would differ from net ROI of seven. Faster validation and higher sales throughput also require an overlap check before addition. Measure successful, quality-controlled validations per dollar, then trace any incremental sales through contribution margin.
Primary-source follow-up: A June 29 Anthropic story names Cox Communications and gives the same first-year return, speed, and cost figures. It says capacity was redirected to growth. The S-1 itself leaves the client unnamed. The public story also contains conflicting lead-accuracy baselines: 13% in its challenge description and 18% in its results. Preserve that discrepancy; neither source provides the complete return calculation.
UST — panel 17, page 224
Subsector: Technology and engineering services. Beneficiary industry: Semiconductors and electronics.
UST is the service provider. The hardware-validation workflow serves semiconductor/electronics clients; provider and client capture differ.
UST reports 50–70% shorter chip-validation cycles and a standard turnaround of four days becoming two. Its Claude-based platform reads schematics, generates and runs regression tests, and compares equipment data with a digital twin. It is also training 20,000 associates worldwide. Filing, page 224.
The four-to-two-day comparison is a 50% elapsed-time reduction, consistent with the lower end of the wider reported range. It says nothing by itself about the number of engineers or their active effort. The valuable question is what that step constrains: an engineering queue, a client milestone, or time to a production decision. Faster validation only advances the overall program when that step lies on the critical path and another bottleneck does not absorb the gain. Measure cycles, staff effort, false positives and missed failures, downstream timing, and contract economics. Keep UST's own benefit distinct from its customer's, and include human approval and validation costs.
Telecommunications
Verizon — panel 18, page 225
Subsector: Integrated telecommunications. Beneficiary industry: Telecommunications.
Classifies the named organization. It is not identified as the unnamed broadband customer in Accenture's filing panel.
Verizon reports that more than 33,000 engineers build with Claude Code. It also describes joining Project Glasswing and working with Anthropic in May 2026 to test Mythos for network cybersecurity. The page offers qualitative descriptions of broader engineering capability and efficiency but no quantified task, time, quality, or financial outcome. Filing, page 225.
The deployment is a meaningful scale signal. It establishes neither the intensity of use nor a monetary return. A responsible reconstruction starts by selecting representative workflows, defining acceptable work, and comparing effort and outcomes over matched periods. Security work also needs an exposure and remediation model, not a salary multiplier. Deployment size can help scale a validated per-unit effect later; it cannot create that effect. The unnamed broadband company on Accenture's page must not be assumed to be Verizon simply because both operate in communications. Keep customer identities and evidence chains separate.
Retail
Walmart — panel 19, page 226
Subsector: General merchandise and grocery retail. Beneficiary industry: Retail.
The Sparky comparison concerns shoppers and retail orders, rather than an enterprise-software customer cohort.
Walmart reports that Sparky orders have 35% higher average value than non-Sparky orders. Sparky's weekly active users grew 110% quarter over quarter, while units sold through it doubled. The page does not give order counts, the comparison quarter, exposure share, or how the cohorts were selected. Filing, page 226.
These are commercial signals, but the average-order-value gap is an association. Shoppers with larger or more complex baskets may be more likely to use the assistant. Expansion in availability can also raise usage and units without establishing incremental demand. A credible valuation needs an experiment or carefully designed comparison, then incremental contribution after fulfillment, returns, mix, and channel substitution. Even the arithmetic requires care: a 35% increase over baseline represents 25.93% of the resulting basket, not 35% of observed Sparky sales. That conditional calculation does not solve causality. Applying an assumed causal haircut to total company sales would hide the more fundamental missing population.
Hospitality
Shy Bird — panel 20, page 227
Subsector: Restaurants. Beneficiary industry: Hospitality.
Shares filing panel 20 with KBF. Restaurant operations are classified separately from the owners' Colette software venture.
Shy Bird reports brunch ticket times more than 60% shorter, down to 12 minutes, after Claude-informed analysis and a kitchen-line redesign carried out with its cooks. The owners’ resulting Colette platform serves 60 restaurants. Filing, page 227.
Shorter tickets may improve service or throughput, depending on demand and remaining constraints. The intervention required physical implementation. Measure peak service, completed orders, quality, customer experience, and contribution alongside redesign cost. The human actions are part of the intervention and its economics, not incidental details to remove from an AI story. Colette is a separate software venture; this entry classifies the restaurant operation.
This organization shares source panel 20 with KBF Design Gallery, classified under Design and remodeling. Splitting the organizations for industry analysis does not create another filing panel.
Design and remodeling
KBF Design Gallery — panel 20, page 227
Subsector: Interior design and remodeling. Beneficiary industry: Design and remodeling.
Shares filing panel 20 with Shy Bird. Its hours and sales-growth claims describe the design/remodeling operation.
KBF reports seven hours removed per contract-scope-writing project, 70 annual projects, and 490 hours returned to one employee. It also reports 32% sales growth since adopting Claude in 2025. Filing, page 227.
Its arithmetic is inspectable: seven times 70 equals 490. The described capture is more design work, not a removed salary. The sales-growth claim needs its baseline, mix, margin, and the contribution of other changes. Extra project contribution and the wage valuation of hours used to produce it are alternative views of the same capacity unless the model establishes distinct benefits.
This organization shares source panel 20 with Shy Bird, classified under Hospitality. Splitting the organizations for industry analysis does not create another filing panel.
Humanitarian services
International Rescue Committee — panel 05, page 212
Subsector: Humanitarian relief and refugee services. Beneficiary industry: Humanitarian services.
Classifies the named humanitarian organization. People served are beneficiaries, not an additional organization count or AI-attributable output.
The IRC reports 464 staff hours returned per week. A 300-user pilot expanded to roughly 2,400 seats between December 2025 and May 2026. Half of pilot users reported saving at least four hours monthly. Separately, the share of key health indicators used in strategic planning rose from 20% to 100%. Filing, page 212.
The page does not identify the population behind the 464 hours, so dividing by 2,400 would not create a measured per-user saving. At 48 sustained weeks, the figure would annualize to 22,272 hours; at 52, to 24,128. Neither is a reported annual result.
Those hours may support better care rather than reduce spending. The appropriate next measure is what staff do with the time and whether service quality, reach, or timeliness changes. The IRC's 20.5 million people served in 2025 is organizational context, not AI-attributable impact. Dividing total spending by total people served cannot establish the marginal cost of helping another person or convert freed hours into extra beneficiaries.
Using the atlas
The next step is not to assign every case a dollar number. Select the operational change, match its population and period, identify who can capture the benefit, and price that specific outcome with its costs and quality constraints. Preserve the reported claim, the transformation into a projection, and the evidence needed to confirm or revise it. That makes the model useful when the workflow, model version, price, or business conditions change.